-
Credits
- Section Writer: Dr. Om J Lakhani
- Section Editor: Dr. Om J Lakhani
-
Linked notes
-
Q. Describe the Insulin siganlling pathway ?
- Please see this video that describes the insulin signal transduction beautifully
graph TD
					A[Insulin] -->|Binds| B[Alpha Subunit IR]
					B --> |Transmit signal intracellularly|C[Activate Beta subunit of IR]
					C -->|Tyrosine kinase phosphorylates|D[Activate IRS1]
					D -->|Phosphorylates| E[Activate PI-3K]
					D -->|Phosphorylates| F[Activate MAP kinase]
					E --> G(Protein Synthesis)
					E --> H(Lipid synthesis)
					E --> |Via AKT| I(Glucose metabolism)
					I --> J(GLUT4 moves to Cell surface)
					I --> K(Glycogen formation)
					J --> L(Uptake of Glucose into the cell)
					F --> M(Cell growth)
					F --> N(Gene expression)
					M --> O(Implicated in cancer)
-
Q. Describe the components that impact insulin resistance ?
- Nutrient excess
- Lack of exercise
- Inflammation
- Excess free fatty acid
- Intramyocellular lipids
- Mitochondrial dysfunction
- Glucocorticoids
- Sleep
- Human placental lactogen
-
Q. How does mTOR lead to insulin resistance ?
graph LR
	A[Excess nutrients activate mTOR] --> B[S6K] --> C[phosphorylation of IRS1] --> D[Insulin resistance]
-
Q. What is the role of AMPK in this ?
graph LR
A[Exercise and metformin] --> B[increase AMPK inhibition of mTOR] --> C[reduces insulin resistance]
-
Q. What is unfolded protein response ?
graph LR
 A[Excess nutrients] --> B[ER Stress] --> C[excess unfolded protein] --> D[Janus kinase activiated] --> E[IRS1 phosphorylation] --> F[insulin resistance]
- To know more about Unfolded protein response and ER stress please see our video on this topic
- To know more about Unfolded protein response and ER stress please see our video on this topic
-
Q. How does inflammation in adipocytes produce insulin resistance ?
graph LR
	 A[Excess white adipose tissue blood supply not able to keep up with it] --> B[hypoxia] --> C[Inflammation] --> D[TNF alpha release] --> E[Activate Janus kinase] --> F[IRS1 phosphorylation] --> G[Insulin resistance]
-
Q. What is the Randle cycle ?
- Excess Free fatty acids reduces Glucose metabolism
-
Q. Describe the process of lipotoxicity and Randle cycle ?
- Randle cycle:
graph TD
A[Increase Free fatty acid increase oxidation of FFA] --> B[increase citrate] --> C[inhibit PFK] --> D[inhibits glucose metabolism pathway] --> E[accumulation of G6P] --> F[reduced glucose uptake by GLUT4 in muscles]
- Randle cycle:
-
Q. How do glucocorticoids produce insulin resistance ?
- Change in body composition → fat moves from periphery to centre
- Increase Free fatty acid
- Reduction of P13K
-
Q. Summarize how obesity leads to insulin resistance ?
graph TD
        X[Obesity] --> A2[Excess white adipose tissue blood supply not able to keep up with it] --> B2[hypoxia] --> C2[Inflammation] --> D2[TNF alpha release] --> E2[Activate Janus kinase] --> F2[IRS1 phosphorylation] -->   Z[Insulin resistance]
        X --> L[Nutrient excess] --> A[Excess nutrients activate mTOR] --> B[S6K] --> F2 --> Z
        X --> M[Excess lipolysis] --> N[increased free fatty acid] --> Z
X --> L --> B1[ER Stress] --> C1[excess unfolded protein] --> E2 --> F2 --> Z-
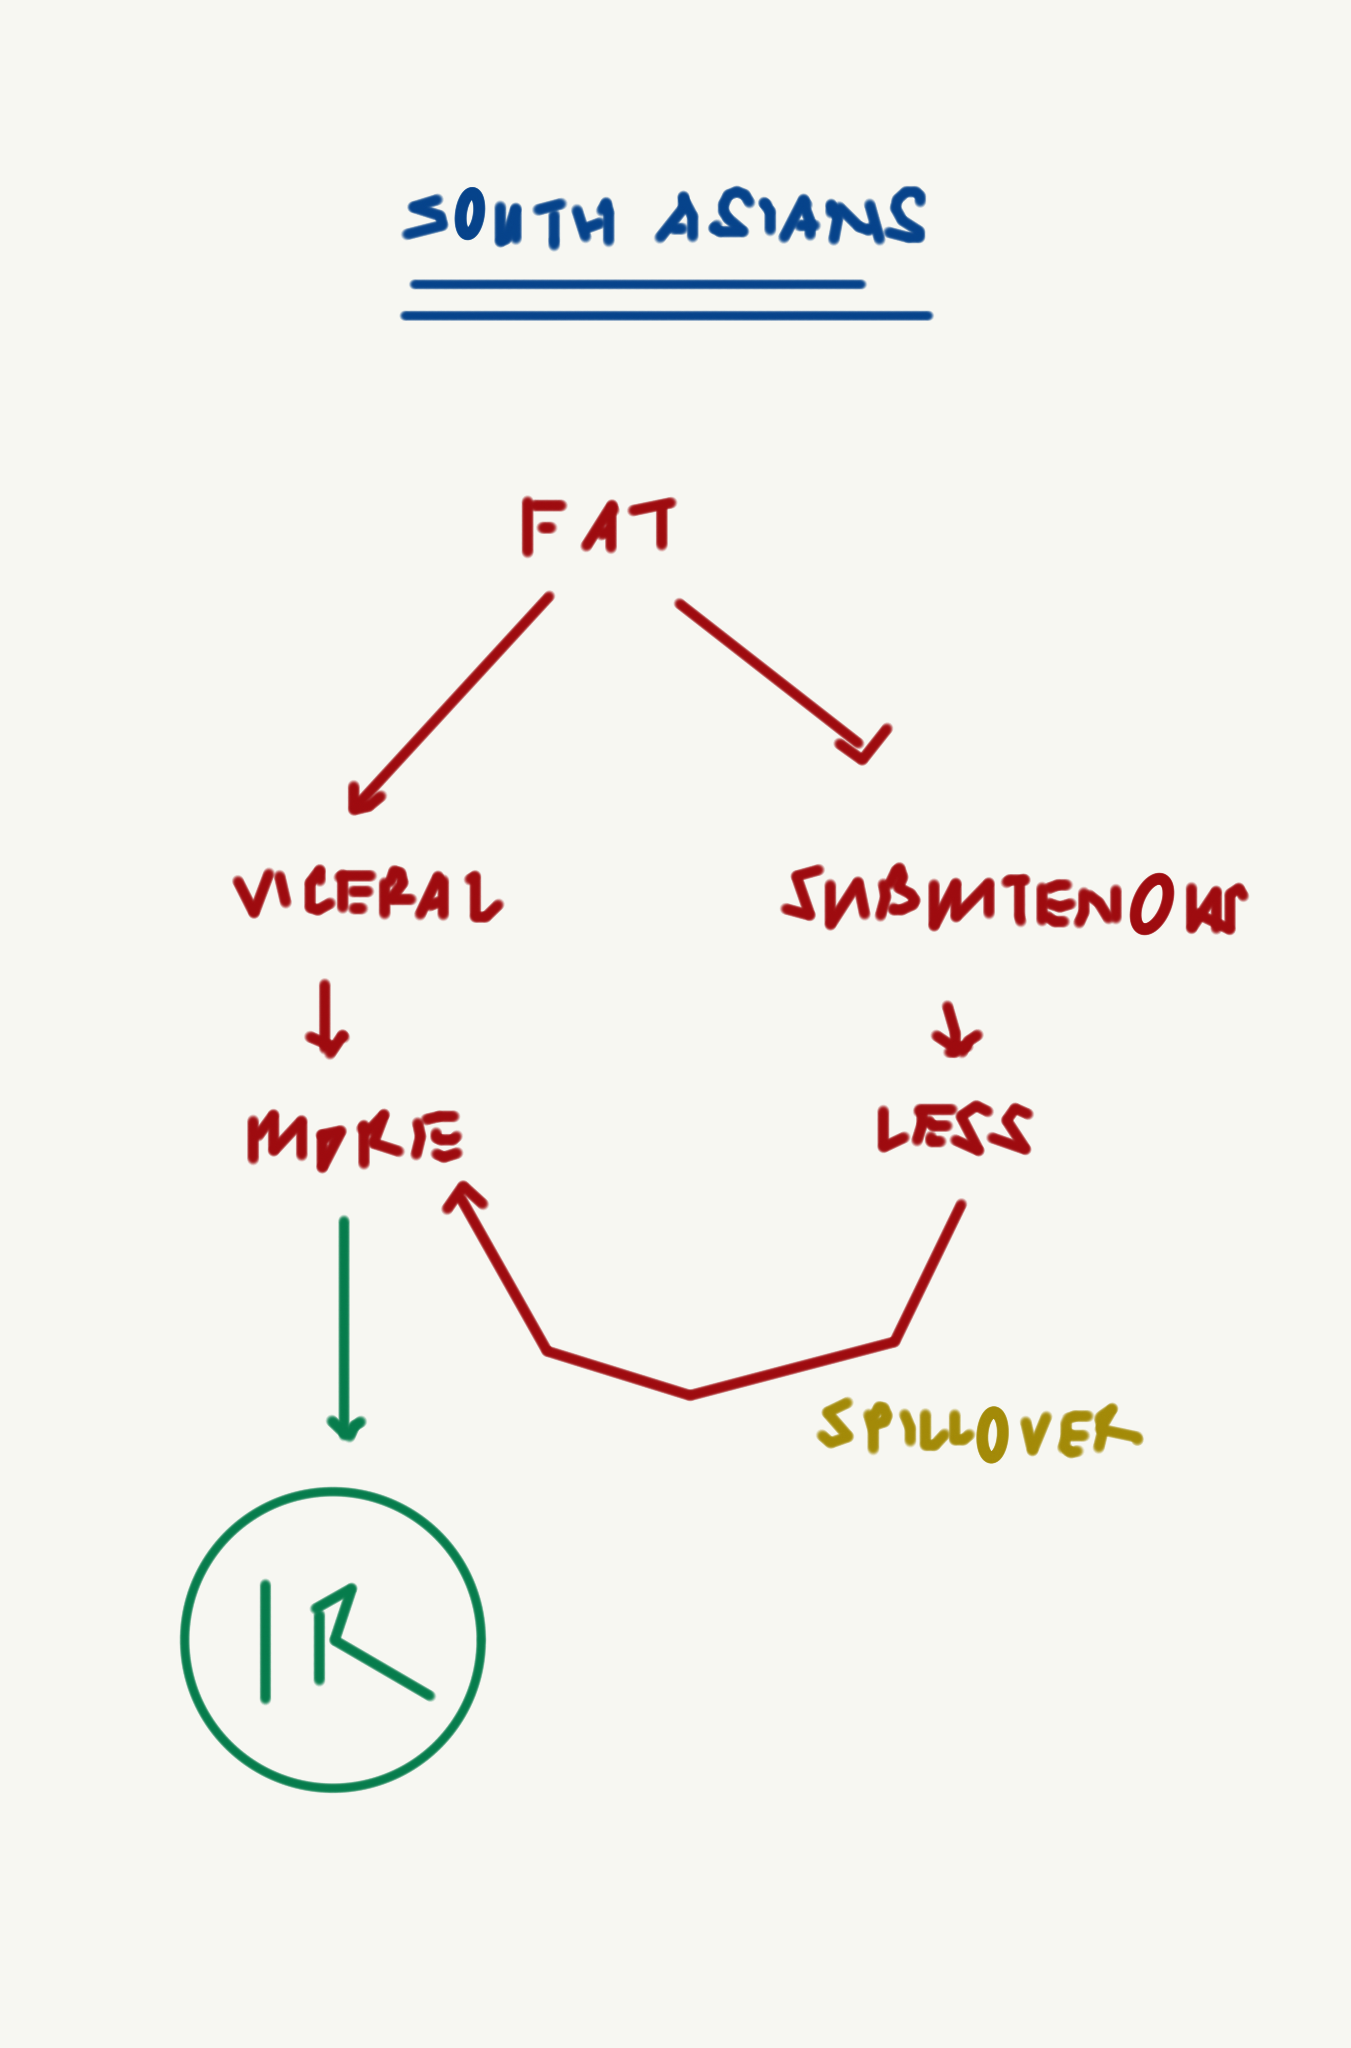
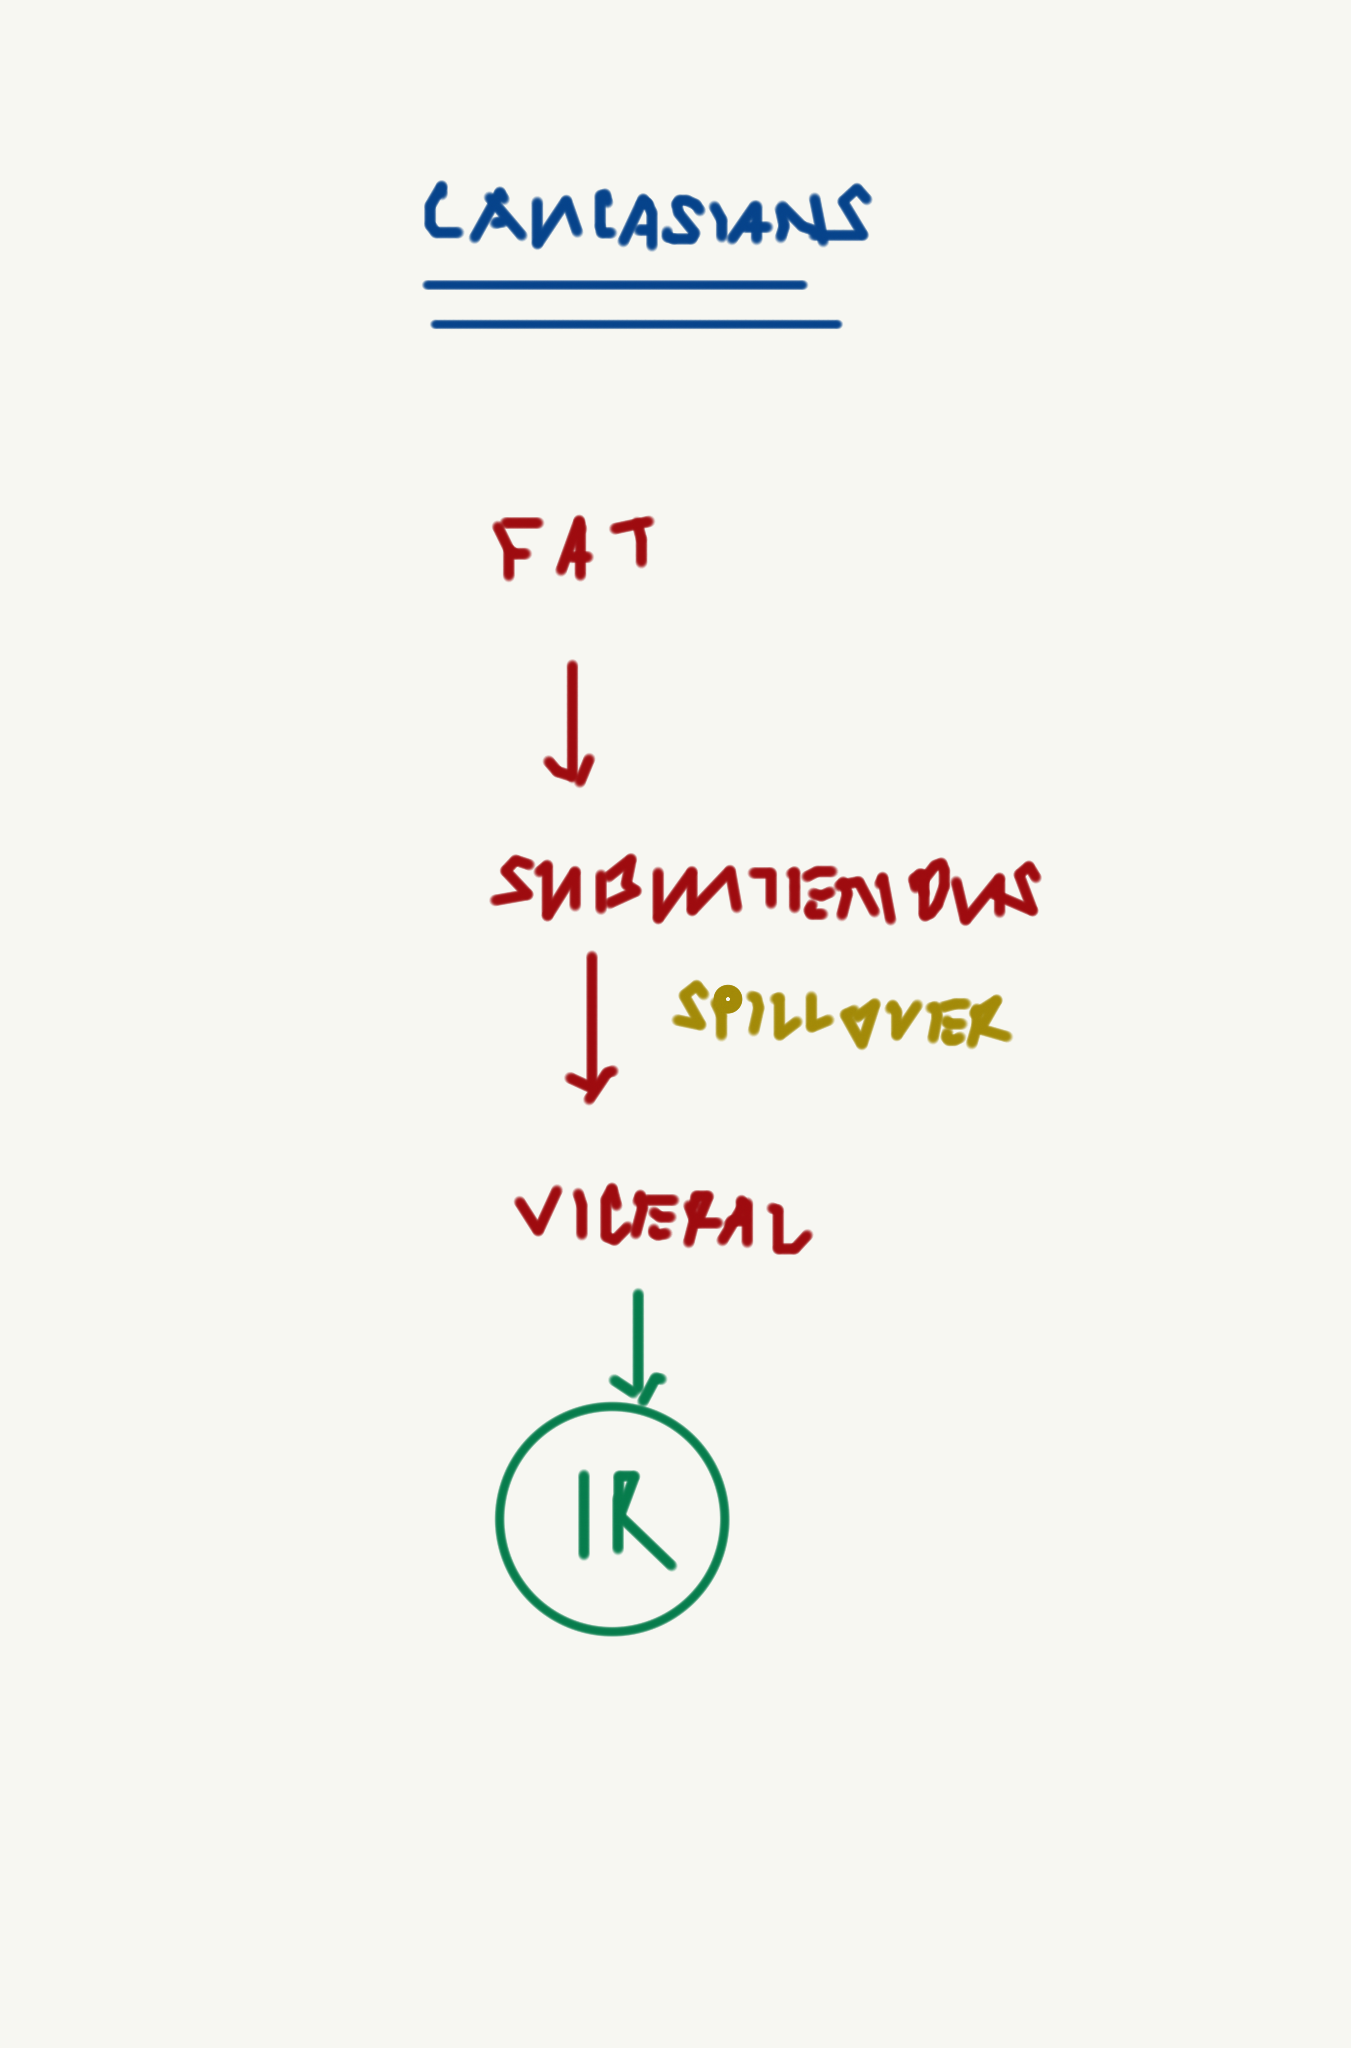
Q. Which is more likely to cause insulin resistance, Subcutenous fat or viceral fat ?
- Viceral fat is known to produce insulin resistance
- Eventually ovewhelming of fat storage in subcutenous regions - leads to spillover to viceral area- leading to more fat storage and insulin resistance
-
Q. Does one impact the other - i.e. if for some reason, the patient cannot store subcutenous fat, there is more ectopic fat storage ?
- Yes
- There is a theory that suggests that if the patient cannot store more subcutenous fat, then they store ectopic fat and vice versa
- This phenomenon is seen in lipodystrophic syndrome
- It is also seen in Sumo wrestlers who are having more subcutenous and less ectopic fat and hence are more healthy
- South-Asians have more viceral fat and have less ability to store subcutenous fat
- This may be some sort of Lipodystrophy variant
- This is why South Asians have poor metabolism compared to Caucasian


-
Q. In terms of chronology what appears first- peripheral insulin resistance or central insulin resistance ?
- Peripheral insulin resistance appears first and it is present for a long time before central insulin resistane (at the level of liver) appears
- However the hepatic insulin resistance immediatley preceeds the development of type 2 diabetes
- Hence NAFLD/NASH is a strong predictor for development of type 2 diabetes

-
Q. Amongst the parameters of a liver profile, which parameters have a strong link with type 2 diabetes ?
- ALT (SGPT)
- GGT
-
Q. Which is an emerging biomarker in this regards ?
-
- It is a hepatokine
- Proinflammatory and antiinflammatory attributes of fetuin-a: a novel hepatokine modulating cardiovascular and glycemic outcomes in metabolic syndrome - PubMed
- Fetuin-A is a novel hepatokine. The number of biologic roles attributed to fetuin-A has increased exponentially in the past decade.
- Fetuin-A is the endogenous ligand for Toll-like receptor-4 activation, for lipid-induced insulin resistance. Fetuin-A has inverse interaction with adiponectin. Increased fetuin-A is a risk factor for diabetes and fatty liver disease in normoglycemia and prediabetes
- Decreased fetuin-A predicts increased disease activity in obstructive lung disease, Crohn's disease, and ulcerative colitis. Both elevated and reduced fetuin-A may be linked with increased cardiovascular events.
- As a proinflammatory molecule, fetuin-A contributes to insulin resistance and is an important link between liver, adipose tissue, and muscles
- Fetuin-A is neuroprotective and plays an important antiinflammatory role in sepsis and autoimmune disorders
-
Q. What is the role of SHBG in this ?
- Low SHBG is a marker of Hepatic Insulin resistance
- This is the pathogenesis implicated for PCOS
- Low SHBG predicts the risk of developing type 2 diabetes in an individual
-
Q. What happens to adiponectin levels with increasing insulin resistance ?
- Adiponectin levels reduce
-
Q. Is Adiponectin a good marker for insulin resistance ?
- Probably not
- No strong data exist for the same and its role in predicting diabetes is limited
-
Q. What is the "adiponectin paradox" ?
- This is common with a lot of biomarkers seen in insulin resistance
- In a physiological sense in a normal individual - a high adiponectin is protective for insulin resistance
- However in a diseased individual it is associated with higher risk of complications
-
Q. In which other situations do you see an adiponectin paradox ?
- natriuretic peptides
- In normal individuals- BNP levels are protective from insulin resistance
- In diseased individual (ie those with type 2 diabetes)- they are associated with adverse cardiovascular situations
- natriuretic peptides
-
Q. Which are the other emerging biomarkers ?
- IL-6
- PAI-I
- Both of these are also associated with increased risk of type 2 diabetes
-
Q. What is the importance of microalbuminuria in this scenario ?
- Microalbuminuria is a marker of vascular dysfunction in both - the patients with diabetes and also patients with insulin resistance not having diabetes
-
-
Q. What are the changes in lipid profile in patients with Insulin resistance ?
- Increased Triglycerides → Has stronger link to risk of developing diabetes
- Reduced HDL → Has stronger association with Cardiovascular disease
- Small dense LDL → Strong association with Cardiovascular disease
Please consider donating to "Notes in Endocrinology" to keep us going. Please visit our DONATION page to know more